TL;DR
Demand five things every month: booked jobs from each channel, cost per booked job, calls that went unanswered, the pages and queries that produced the calls, and a plain task log of what was done. Ask for the raw Search Console screens beside any chart.
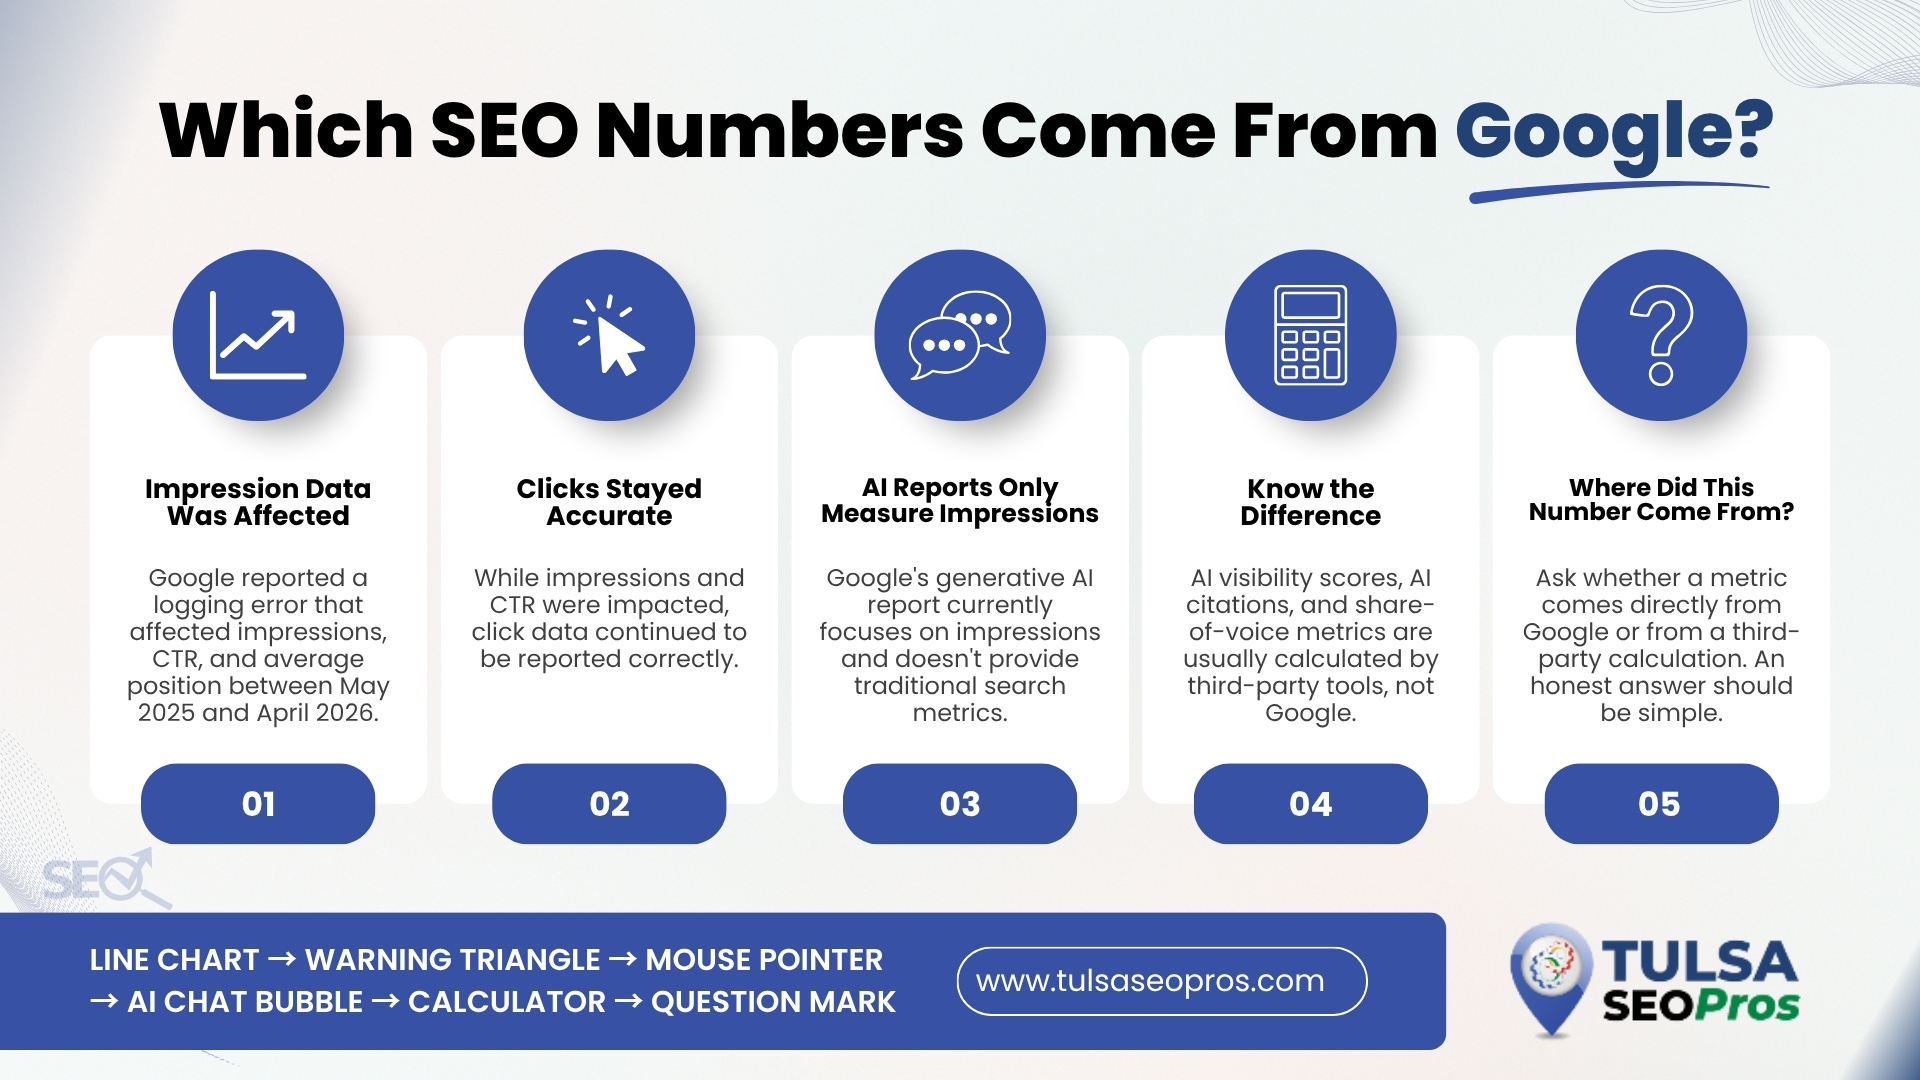
Three facts from Google’s documentation change how you read those charts. Query rows never sum to the chart total because private queries are hidden from the table while still counting toward it. Position means the topmost spot your link held, not a typical rank. The generative AI report shows impressions only, so any figure labelled AI clicks or AI citations was invented somewhere.
Four Numbers That Decide Whether the Month Worked
Start at the bottom of the funnel and work up.
A booked job is money. A lead is a maybe. An impression is weather.
The four we lead with, in this order:
| Number | What it answers | Where it comes from |
| Booked jobs by channel | Did the phone ring for a real job | Your CRM or dispatch software, tagged by source |
| Cost per booked job | What each channel charges you per job | Channel spend divided by booked jobs |
| Unanswered calls | How much of the spend leaked before it reached a technician | Call tracking logs, by hour |
| Calls by page | Which pages earn their hosting | Call tracking plus analytics, page level |
Unanswered calls belong on page one of any report, and almost no agency puts them there because it makes the agency look bad for a problem it does not control. It should still be there. A shop paying for search visibility while dropping calls between four and six on a July afternoon is buying inventory it never picks up. We would rather show an owner that number in month one than defend a traffic chart in month six.
Cost per booked job settles arguments that cost per lead cannot.
Two channels can produce identical lead counts while one sends tire kickers and the other sends replacements. Split the figure by service line if your software allows it, because a maintenance call and a system changeout have no business sharing an average, and an owner who only sees the blended number will keep funding whichever channel happens to be cheapest per phone call rather than cheapest per invoice. That is how a shop ends up with a busy dispatch board and a flat quarter.
Why Do the Query Rows Never Add Up to the Total?
Because Google hides some of them on purpose. Rare searches, the ones only a handful of people typed, get withheld from the table to protect the privacy of the person searching. Those searches still happened and still counted. Google’s own troubleshooting page is plain about it: “anonymized (rare) results are omitted from the table, but are included in the chart totals unless a query filter is applied”, per the Search Console guidance on performance data discrepancies.
Two things follow, and both matter in a contractor’s report.
The first: adding the query rows up will always land under the headline number. For a heating and air company in Broken Arrow or Owasso, the withheld rows are exactly the searches you most want to read: long, specific, half-panicked phrasing typed by one household at eleven at night. Nobody else in Oklahoma typed that sentence this month, so it never reaches the table. The same page notes a second cause: the table caps at 1,000 rows, so long-tail rows drop out of the table while staying in the chart total.
The filter behaviour bites harder.
Apply one and the hidden rows leave entirely, which is why Google warns that “match” and “does not match” totals may not add up to the unfiltered total. Filter by a keyword, a page, or a folder and the number handed to you excludes every anonymized search that would otherwise have counted. An agency that filters to its own target keywords is showing you a subset and calling it the month.
Honest presentation is simple. Give the total, give the itemized table, and add one sentence saying the two do not match and why.
Average Position Is Not Your Rank
Read the definition before arguing with the chart. Position is “the topmost position occupied by a link to your property or page in search results, averaged across all queries”, per Search Console’s own performance report metrics documentation. Topmost. If your site appears twice on a page, only the higher spot counts, and the number is then averaged across every query in whatever slice you are viewing.
That definition breaks three habits at once.
An average position of 14 does not mean you sit at 14 for anything. It can mean position 3 for a handful of searches nobody runs and position 40 for the searches that pay. Average position also moves when the mix of queries moves, with no change in ranking at all. Pick up impressions for a batch of weak national phrases and your average drops while your actual standing on “furnace repair Jenks” is untouched.
The number is also Search only. Google states position is calculated for Google Search results, so Maps behaviour and everything happening outside Search sits outside it.
So we show a small set of named queries that matter to the business, each carrying its own position and click count, tracked month over month against the same month last year. Ten rows an owner recognises beats one average taken across four thousand rows nobody has read.
Insist on that table by name.
Your Impression Charts From Last Year Were Overstated
Almost nobody mentions this one, and it is documented in Google’s own logs.
Google’s data anomalies page records that “a logging error prevented Search Console from accurately reporting impressions from May 13, 2025 until April 27, 2026”, that the issue is resolved, and that “only impressions and related metrics – CTR and average position – were affected; clicks were not affected by the error”, per the data anomalies log Google keeps on the same Search Console help site.
Sit with what that does to a year-over-year slide, because it is worse than it first looks. Any comparison whose earlier window falls inside those dates is measuring today’s corrected impressions against yesterday’s overstated ones, and the current month loses by default. Click-through rate inherits the same distortion, since impressions are its denominator. Position inherits it too.
Clicks came through clean.
So did your booked jobs, which were never inside Search Console to begin with. If a report you received this spring blamed a “visibility decline” on the previous quarter’s work, check whether the drop lands on 27 April 2026. That is a logging correction, not a ranking event, and an agency that cannot tell you which one it was is reading the same chart you are.
What Can a Report Honestly Say About AI Answers?
Impressions, on some properties, and nothing else. A generative AI performance report now sits in Search Console. It counts how many times links to your site were shown to a user inside a generative AI feature, and it groups that count by pages, countries, dates, and devices. No clicks. No position. No queries.
Google is also still rolling the report out “to a subset of website owners”, so plenty of properties do not have it yet, per Search Console’s help page for the generative AI performance report.
Anything beyond an impression count is therefore a guess wearing a number. AI clicks, AI citations, AI share of voice, an AI visibility score out of 100: none of those are available from Google, so whoever printed them built them from a model or from a scraper hitting an AI product and counting mentions. That may be interesting. It is not a measurement, and it should never sit in the same table as booked jobs.
Google went further in June 2026 and addressed the sales pitch directly. Its guidance on third-party services names services that promise “improvements for AI experiences and search formats (also known as ‘AEO’ or ‘GEO’ tools’)”, warns that “Google doesn’t evaluate third-party services, so be wary of such claims and those making them”, and states plainly that third-party tools “don’t have access to our internal ranking data. They can’t guarantee performance.” Google’s test for advice worth taking is that it either qualifies claims as opinion from data and experience, or cites official Google guidance. That is the standard in the third-party SEO guidance, and we hold our own reports to it.
Ask any prospective partner one question about this and listen carefully: which of these numbers comes from Google, and which one did you calculate? An honest answer takes ten seconds. A long one is the answer.
Dates Move, and They Move on Pacific Time
Fresh data is not finished data. The newest points are marked preliminary and drawn with a dotted line, “still being collected and might change in the next few hours”, per Search Console’s performance report help page.
The calendar shifts too. Search Console runs on Pacific Time, not Central: the Search Analytics API reference on developers.google.com sets start and end dates “in PT time (UTC – 7:00/8:00)”. A Tulsa contractor’s reporting day therefore closes at two in the morning local, which quietly pushes two hours of Sunday night emergency calls onto the next row. Close the window a few days early and never conclude from a partial week.
Tulsa Weather Writes Half of Your Chart
Compare August to November, and you are grading your marketing on the thermometer. NOAA’s 1991 to 2020 climate normals for Tulsa International Airport, published through the NOAA U.S. Climate Normals program, put the numbers past argument.
| Month | Normal high (F) | Cooling degree days | Heating degree days |
| July | 93.1 | 555 | 0 |
| August | 93.1 | 533 | under 1 |
| October | 73.0 | 63 | 162 |
| November | 60.9 | 8 | 450 |
| January | 48.0 | under 1 | 845 |
August carries roughly eight times October’s cooling demand. Cooling load then collapses to almost nothing by November while heating load climbs past 450 degree days. An air conditioning company in Bixby, Sand Springs, or Sapulpa will watch search demand fall off a cliff in October no matter how good the marketing was, and a plumbing company sees the mirror image when the first hard freeze pushes burst-pipe calls through Jenks and Claremore.
Two rules come out of that. Compare each month against the same month last year, not against last month. And where a year-over-year comparison crosses the impression logging window described earlier, lean on clicks and booked jobs, which were never affected.
That second rule is more work than it sounds, because most reporting tools default to the previous period. A September report drawn that way grades your September against August, which in Green Country means grading it against 264 cooling degree days of demand you cannot manufacture. Keep both views if you like, but let the year-over-year panel drive the conversation and let the month-over-month panel sit underneath as context.
Plumbing runs on the opposite clock. Heating degree days climb from 24 in September to 450 in November, and the first hard freeze of the season generates a week of burst-pipe and frozen-hosebib calls that will never repeat in the same shape twice. Judging a plumbing campaign on the January number alone flatters it; judging it on the June number alone buries it. Read the pair.
Seasonality also decides when work should be done rather than reported. Pages and content aimed at heating want to be indexed and settled well before the cold, not written the week the furnace calls start. That timing conversation is worth having with whoever runs your search work, and it is the part of the calendar we build first with a Tulsa HVAC digital marketing agency engagement rather than the part we report on afterwards.
One Page Beats a Forty-Page PDF
A long report is usually hiding a short answer.
What we send fits on a page, with the detail attached behind it for anyone who wants to check the work.
The page carries the four business numbers, then a short search block: total clicks and impressions with the anonymized-query caveat stated, ten named queries with position and clicks, the pages that gained or lost, and any Google anomaly that touched the window. Under that goes the task log. Plain language, dated, listing what was published, what was fixed, and what was submitted for indexing. If nobody can name the work in ordinary sentences, the retainer bought reporting rather than work.
Screenshots of the raw Search Console screens go in the attachment, unfiltered.
Any agency can build a dashboard that looks like progress, and the prettier the dashboard, the less often anyone checks it against the source. Very few will hand you the unfiltered screens beside the summary. We do, because the caveats in this article only mean something if you can see the numbers they apply to, and because an owner who can read their own Search Console is a better client to work with than one who cannot. It also keeps us honest in months where the answer is that nothing much has moved.
Different trades get different fifth rows. For roofing marketing work, it is storm-driven demand spikes; for plumbers across Green Country, it is emergency versus scheduled split; for shops fixing cars, it is repeat customer rate. The four core numbers do not change.
One more thing worth checking annually rather than monthly: whether the site itself can carry the traffic. Page speed, forms that submit, and phone links that dial are web development Tulsa questions, and no amount of reporting fixes a booking form that fails on an iPhone.
Put These Four Numbers on Your Next Report
Open the report you get next month and check four things.
- Booked jobs and what each one cost, named on the first page.
- A written note that query rows do not sum to the total, with the reason.
- Every AI figure labelled either as a Google impression count or as the vendor’s own calculation.
- A dated task log a human can read.
Miss two of those and you are paying for a chart, not for work. We are Tulsa SEO Pros, we work with heating, plumbing, roofing, and auto shops across Green Country, and we will walk your current report with you line by line before you change anything. If your existing setup is working, we will tell you that too. Our SEO services Tulsa page explains how we scope the work, and About Us covers who you would actually be talking to.