An HVAC advertising budget in Oklahoma should follow the thermometer, and Tulsa’s thermometer is unusually easy to read. The 1991 to 2020 climate record puts about 74 days a year at 90F or hotter, almost all of them from June through August, and 72 nights at freezing or below, clustered from December through February. Between them sit two short, quiet stretches in April and October when neither the furnace nor the air conditioner is working hard. Spend heavily into the peaks, pull back through the lulls, and keep enough running in between that you are not starting from zero when the first heat wave or hard freeze arrives in Tulsa, Broken Arrow, or Owasso.
TL;DR
Tulsa averages about 74 days at 90F or above and 72 nights at 32F or below each year, based on 1991 to 2020 normals. Cooling demand peaks in July and August, with roughly 24 and 22 days of 90F heat. Heating peaks in December and January, with about 18 and 22 freezing nights. The median first fall freeze in Tulsa County is November 4, and the median last spring freeze is March 31. April, May, and October carry the lowest combined heating and cooling load of the year, so those are the months to trim ad spend, shift budget toward maintenance offers, and put work into search pages and your Business Profile. Keep campaigns running at a lower budget rather than switching them off, because demand in Oklahoma arrives with the weather, not the calendar: August 2026 was the state’s third-warmest August on record.
A Month-by-Month HVAC Ad Calendar for Tulsa
Start with the weather, then set the budget. The table below uses 1991 to 2020 normals for Tulsa International Airport from the NOAA U.S. Climate Normals program: average days at 90F or hotter, average nights at 32F or colder, and the monthly heating and cooling degree days that measure how hard homes have to work.
| Month | Days 90F+ | Nights 32F or below | Cooling degree days | Heating degree days | Ad posture |
|---|---|---|---|---|---|
| January | 0 | 21.5 | 1 | 823 | Heating peak |
| February | 0 | 15.5 | 2 | 622 | Heating, easing |
| March | 0.2 | 6.8 | 15 | 418 | Taper heating |
| April | 0.4 | 1.1 | 53 | 179 | Low: maintenance |
| May | 3.0 | 0 | 183 | 41 | Build toward cooling |
| June | 14.2 | 0 | 407 | 1 | Cooling ramp |
| July | 24.0 | 0 | 569 | 0 | Cooling peak |
| August | 22.2 | 0 | 535 | 0 | Cooling peak |
| September | 9.0 | 0 | 281 | 17 | Taper cooling |
| October | 1.0 | 0.7 | 74 | 160 | Low: maintenance |
| November | 0 | 8.0 | 8 | 446 | Heating ramp |
| December | 0 | 18.3 | 1 | 744 | Heating peak |
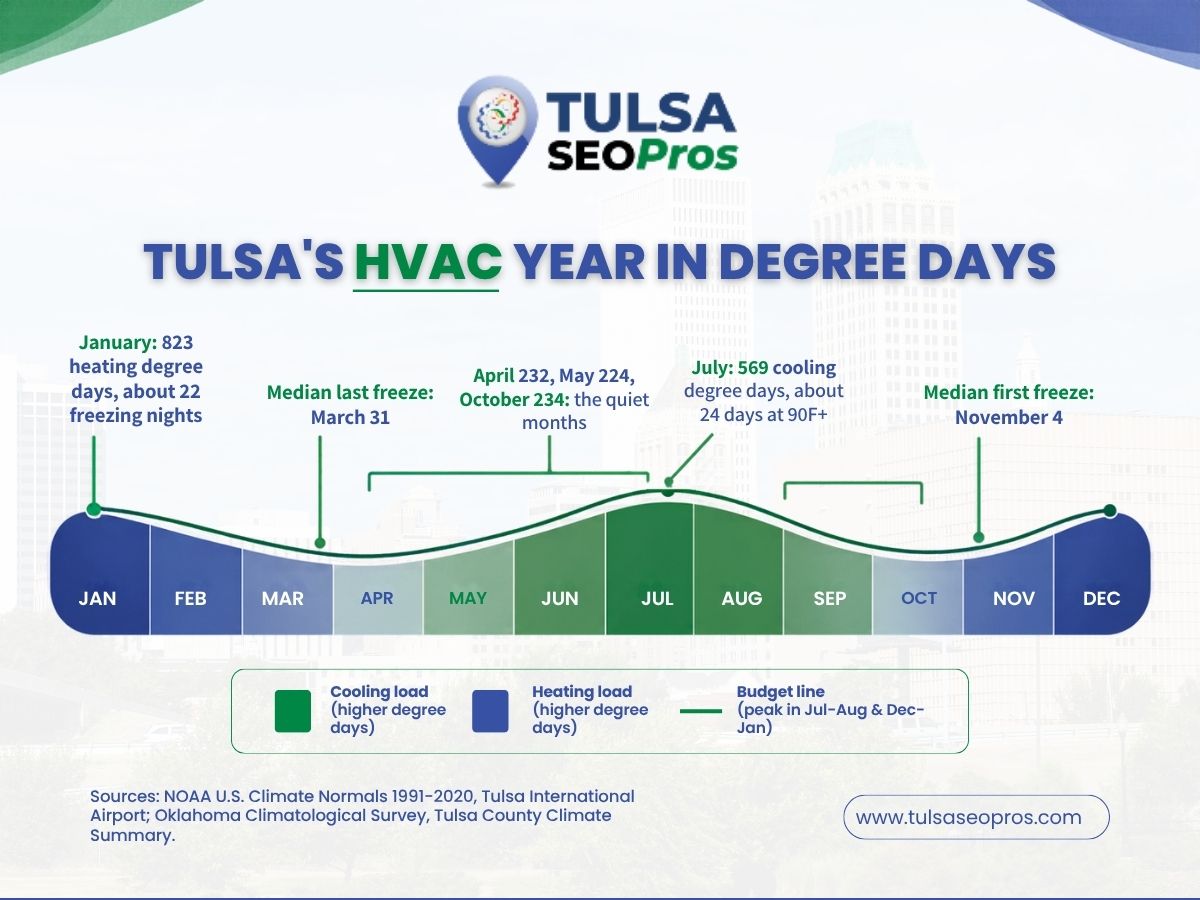
Degree days are the useful column. A cooling degree day counts how far a day’s average temperature ran above 65F, and a heating degree day counts how far it ran below, so the monthly totals track the load on equipment. July’s 569 cooling degree days against October’s 74 is the whole story of an Oklahoma HVAC year in two numbers.
Add the two columns together and three months stand out as quiet: April at 232, May at 224, and October at 234. Every other month carries more than 290.
That is where to pull back.
Why Cooling Season Gets the Biggest Share
July and August carry more degree days than any other pair of months, and the heat is concentrated. Almost all of Tulsa’s 74 hot days fall between June and September.
The Oklahoma Climatological Survey’s Tulsa County climate summary, published through the Oklahoma Mesonet, adds the extremes. It lists 74 days a year above 90F and 11 above 100F in Tulsa County in 1991 to 2020 averages, against 2,128 cooling degree days a year. When a unit quits on one of those 100-degree afternoons, the call that follows is a repair or a replacement, not a tune-up.
For the budget, that means:
- Raise daily budgets through late May and June, before the first run of 90-degree days, so campaigns have history when demand jumps.
- Hold the highest budgets of the year for July and August.
- Keep repair and replacement searches funded ahead of maintenance terms in those months.
- Start tapering in September, when hot days drop to about nine.
What summer 2026 did to that calendar
Normals are averages. This summer was not average.
The Oklahoma Mesonet’s August 2026 climate summary reports a statewide average of 86.5F, 5.7F above normal, the third-warmest August since statewide records began in 1895. The statewide average high was 100.8F. Tulsa had its fifth-hottest August on record, and June through August ranked as the sixth-warmest summer. January through August 2026 was the warmest such stretch on record, and the Climate Prediction Center’s September outlook favored above-normal temperatures across the whole state.
The Mesonet’s July summary shows how the heat built. July ran 2F above normal statewide, and the final third of the month brought triple-digit temperatures across much of the state, with Okmulgee’s heat index reaching 125F on July 21. Earlier, on July 4, storms damaged trees and power lines around Tulsa, and PSO reported a peak of 24,522 customers without power. Outages and heat together are the kind of week when a no-cooling call cannot wait.
A contractor who cut spending on September 1 because the calendar said summer was over left calls on the table this year. Read the forecast before you read the calendar.
Heating Season Starts Later Than Most Budgets Think
Heating ads usually go live too early and too late at the same time. Too early, because October is one of the quietest months of the year. Too late, because the budget is still small when the first hard freeze arrives.
The Tulsa County summary puts the median first fall freeze on November 4, with the earliest freeze (the 10th percentile) around October 20. Freezing nights then build fast: about 8 in November, 18 in December, and 22 in January, with 3,451 heating degree days across the year.
| Date marker, Tulsa County | What it means for ads |
|---|---|
| October 20, earliest likely freeze | Heating campaigns built, running on a small budget |
| November 4, median first freeze | Raise heating budgets |
| December and January | Heating peak, highest winter budgets |
| March 31, median last freeze | Begin tapering heating spend |
| April 15, latest likely freeze | Heating terms down to a floor |
Winter events matter as much as averages. The Mesonet’s January 2026 summary describes a January 23 to 25 winter storm that dropped lows below zero at many stations, with some areas below freezing for well over five straight days. A cold snap like that produces no-heat calls from Jenks to Owasso within hours, and a heating campaign sitting at a tiny off-season budget cannot absorb them.
How to Pull Back Without Switching Off
Pulling back means lowering budgets, not pausing campaigns. A paused campaign stops collecting data, and the first hot week of June is a bad time to restart one cold.
Spend in Google Ads is set through an average daily budget. The Ads Help page on average daily budgets explains that on busier days a campaign can spend up to twice its average daily budget, while the monthly charge stays capped at 30.4 times that average. That is useful in Oklahoma: a campaign left running at a modest budget in April can still stretch on the one warm afternoon when calls spike, without blowing the month.
For April, May, and October, here is how we would handle it:
- Cut budgets on emergency repair and replacement terms to a floor rather than zero.
- Move the savings to maintenance and tune-up searches, which are what homeowners plan in the shoulder months.
- Tighten location targeting to the towns you serve most, such as Bixby, Jenks, and Broken Arrow.
- Review search terms and add negatives while volume is low and the list is short.
- Leave brand campaigns fully funded all year.
None of this is a fixed percentage. The right floor depends on how many calls your team can take and what a booked job is worth, which is why we would start from how much a trades company should spend on marketing as a share of revenue before setting any monthly number.
Should You Tell Google Ads About a Heat Wave?
Sometimes, and only briefly. Google Ads Help describes seasonality adjustments as an advanced tool for telling Smart Bidding to expect a major change in conversion rates during a future event. Google says they suit short events of one to seven days and may not work as well over periods longer than 14 days. It also warns they should be used only when you expect major changes, because Smart Bidding already manages seasonal events.
Read against the Tulsa calendar, that rules out the obvious misuse. Summer is not an event. Setting an adjustment for all of July tells the bidder something it already knows.
A forecast three-day stretch of 105F heat or a hard freeze inside the next week is closer to what the feature is for. Seasonality adjustments work with Search campaigns using Target CPA or Target ROAS bidding, plus Performance Max, so check the bid strategy before relying on one.
| Situation | Use a seasonality adjustment? |
|---|---|
| Normal summer peak | No, Smart Bidding already expects it |
| A forecast 3-day heat wave | Worth considering |
| The first hard freeze, forecast days ahead | Worth considering |
| A two-month slow season | No, lower the budget instead |
| A one-week maintenance promotion | Yes, this is the use Google describes |
How to Check Your Own Numbers Against the Weather
The table above is Tulsa’s weather. Your call log is your business. Putting the two side by side takes an hour and tells you more about your budget than any rule of thumb.
- Export twelve months of booked calls or jobs by month from your dispatch or call tracking system. Separate cooling, heating, and maintenance if you can.
- Export twelve months of ad spend by month from Google Ads, split the same way if your campaigns allow it.
- Put both next to the cooling and heating degree-day columns from the calendar table.
- Mark every month where spend rose while degree days fell, and every month where degree days rose but spend stayed flat.
- Look at the first two weeks of June and the first two weeks of November on their own. Those are the ramps, and they are where budgets most often lag the weather.
What you are looking for is shape, not precision. If your cooling calls climb with the degree days and your spend climbs a month later, the budget is chasing demand instead of meeting it. If spend in October matches spend in July, money is going out in a month with about an eighth of July’s cooling load.
| What the comparison shows | What to change |
|---|---|
| Spend flat all year | Rebuild around peaks and floors |
| Spend peaks after calls peak | Move budget increases a few weeks earlier |
| October spend close to July spend | Cut October to a floor, shift to maintenance terms |
| Heating spend starts in late November | Raise it before the November 4 median freeze |
| Calls spike on single hot or cold days | Keep a running floor budget so campaigns can stretch |
Do the same check again next September. One year of Oklahoma weather is noisy, and 2026 alone ran well above the averages, so two years of your own numbers beside the normals are far more useful than one.
What the Quiet Months Are Actually For
Search pages and a Business Profile keep working in January and July alike, and they take months to build. Use April and October to publish the furnace and heat pump pages you will need in November and fix what the summer rush exposed. That gap is the natural slot for organic search work, and our HVAC digital marketing guide for Tulsa contractors covers the channels in more depth.
A short checklist for the October lull:
- Heating service pages updated and indexed before November.
- Business Profile services and hours checked for winter.
- Last summer’s search terms reviewed and negatives added.
- Call handling tested before the first freeze, not during it.
Build Next Year’s HVAC Ad Budget Around Tulsa Weather
Pull up last year’s monthly spend and set it beside the degree-day table. If spending was flat through the year, or highest in October, the budget is fighting the weather. Rebuild it with peaks in July, August, December, and January, floors in April, May, and October, and ramps in June and November.
That seasonal split is the plan we would bring to PPC management for contractors, alongside the rest of our heating and cooling marketing in Tulsa, Broken Arrow, and Owasso. If you want a second opinion on your own calendar, Tulsa SEO Pros will line up your last twelve months of spend against the weather and show where the money went early, late, or not at all.